MERSCOPE mouse liver
In this notebook, we will use ovrlpy to investigate the Vizgen MERSCOPE’s mouse liver dataset.
We want to create a signal embedding of the transcriptome, and a vertical signal incoherence map to identify locations with a high risk of containing spatial doublets.
Settings and Imports
First, let’s define settings and input files.
from pathlib import Path

import matplotlib.pyplot as plt

import ovrlpy
sample_nr = 1
slice_nr = 1

# TODO: adjust path
data_path = Path("path/to/downloaded_data") / f"Liver{sample_nr}Slice{slice_nr}"
Loading the data
Next, we want to load the data.
coordinate_df = ovrlpy.io.read_MERSCOPE(data_path / "detected_transcripts.csv")

print(f"Number of transcripts: {len(coordinate_df):,}")
Number of transcripts: 417,243,171
coordinate_df.head()
shape: (5, 4)
| x | y | z | gene |
|---|---|---|---|
| f64 | f64 | f64 | cat |
| 2506.407 | -95.45148 | 0.0 | "Comt" |
| 2531.8447 | -95.18702 | 0.0 | "Comt" |
| 2483.7969 | -91.360115 | 0.0 | "Comt" |
| 2505.7693 | -84.08165 | 0.0 | "Comt" |
| 2501.394 | -81.38709 | 0.0 | "Comt" |
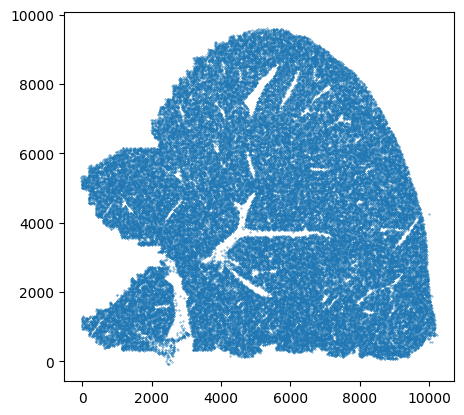
Tissue overview
# only show every 5,000th transcript
n = 5_000

fig, ax = plt.subplots()
ax.scatter(coordinate_df[::n, "x"], coordinate_df[::n, "y"], s=0.1)
_ = ax.set(aspect="equal")
Running the ovrlpy pipeline
ovrlpy provides a convenience function run to run the entire pipeline.
The function creates a signal integrity map, a signal strength map and a Visualizer obejcet to visualize the results.
# ensure reproducibility by setting random_state
# min_distance???
liver = ovrlpy.Ovrlp(coordinate_df, n_components=10, n_workers=8, random_state=42)
liver.analyse()
Running vertical adjustment
Creating gene expression embeddings for visualization
determining pseudocells
found 94105 pseudocells
sampling expression:
100%|██████████| 72/72 [03:33<00:00, 2.96s/it]
Modeling 10 pseudo-celltype clusters;
Creating signal integrity map
100%|██████████| 420/420 [14:50<00:00, 2.12s/it]
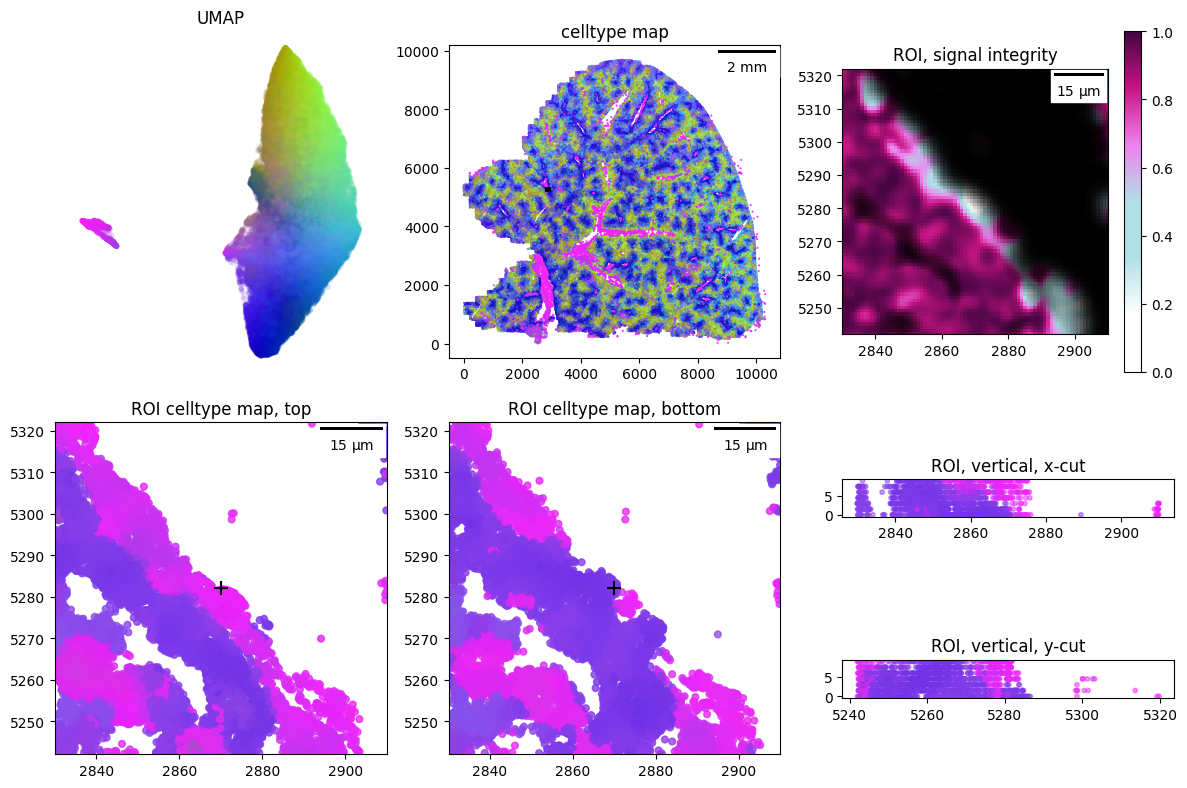
_ = ovrlpy.plot_pseudocells(liver)
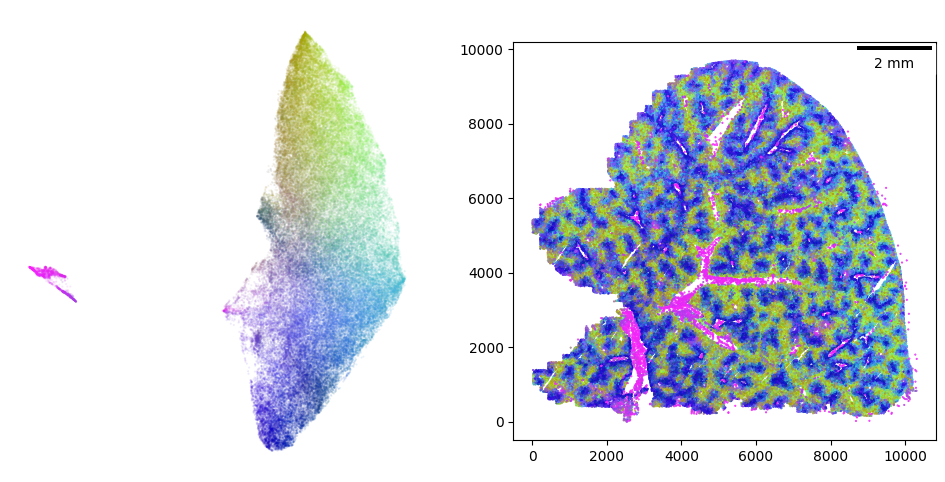
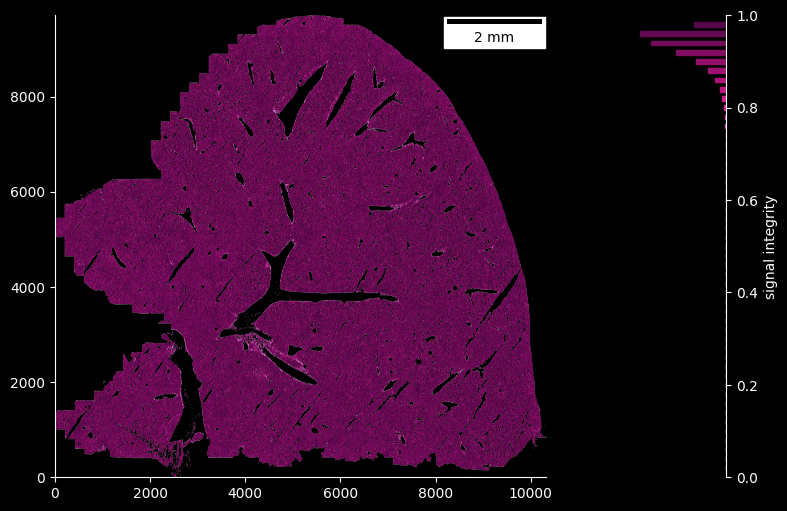
Signal integrity of the liver sample
fig = ovrlpy.plot_signal_integrity(liver, signal_threshold=3)
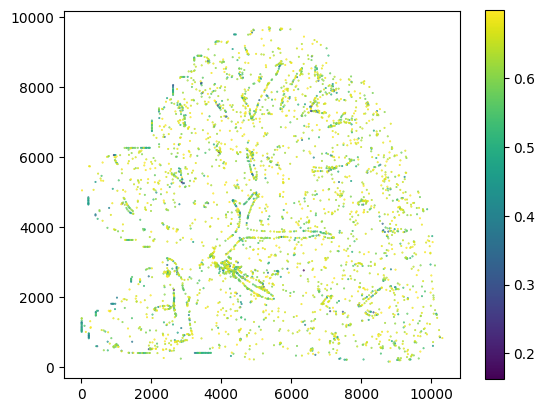
Doublet probability
doublets = liver.detect_doublets(min_signal=3, integrity_sigma=3)
fig, ax = plt.subplots()
_scatter = ax.scatter(
    doublets["x"], doublets["y"], c=doublets["integrity"], s=0.2, cmap="viridis"
)
_ = ax.set_aspect("equal")
_ = fig.colorbar(_scatter, ax=ax)
Visualize a specific doublet event like so.
doublet_case = 1

x, y = doublets["x", "y"].row(doublet_case)

_ = ovrlpy.plot_region_of_interest(liver, x, y, window_size=40)